
There are many ways to check how the property you want to invest in is performing. Some investors focus on metrics like net income, while others examine more detailed calculations. But sometimes, you just want a quick way to see how long it might take to get your money back from rent. Today, let’s talk about gross rent multiplier—what is a good gross rent multiplier? It simply shows how long it could take you to earn back your investment through rent.
Let’s break it down and compare it with other metrics. By the end, you’ll know what a good one looks like and how to use it for better analysis. Read along to understand it and confidently add GRM to your arsenal when analyzing the value of a property.
Main Takeaways
-
GRM basics: Gross Rent Multiplier (GRM) is a quick way to check how many years it would take for rent to equal a property’s purchase price. A “good” GRM often falls between 4–7, while 10+ can signal an overpriced deal.
-
Factors & use: Location, property type, market trends, condition, and rent potential all affect GRM. It’s best used as a first filter, then paired with deeper metrics like Cap Rate or cash-on-cash return.
-
Investor takeaway: Online GRM tools can help, but expert property management brings the whole picture—covering analysis, sales, and day-to-day rental management.
 What Is Gross Rent Multiplier?
 What Is Gross Rent Multiplier?
As a company offering property management in Baltimore, we often find ourselves in investment discussions with clients. One common question that comes up is: which metric gives the clearest picture of how a property is performing, or what to expect from a new building? The truth is, there are several useful metrics.
One of the quickest ways to get a snapshot of a property’s potential is by looking at the Gross Rent Multiplier (GRM). This simple calculation helps investors see whether a rental looks like a good deal. You find it by dividing the property’s price by the total annual rent it generates. The result shows how many years it might take for rental income to cover the purchase price—before factoring in any expenses like taxes, insurance, or repairs.
That said, because it does not account for operating costs, GRM is not a true measure of a property’s payback period. Rather, it’s a valuable comparative tool for quickly assessing the relationship between a property’s price and its top-line rental income.
How to Calculate Gross Rent Multiplier
The best part about GRM is its simplicity. You don’t need complicated spreadsheets or financial software. You just need two numbers to calculate it. That is:
- The purchase price of your property
- The total annual rental income
Then, use this simple formula:
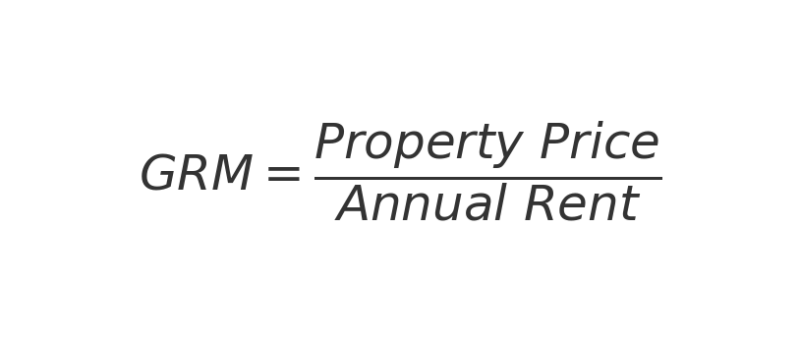
GRM = Property Price / Annual Rent
Example:
Let’s say you’re looking at a property priced at $200,000, and it brings in $2,000 a month in rent. First, calculate the annual rent:
2,000×12=24,000
Now divide the price by the annual rent:
200,000÷24,000=8.3
So, the Gross Rent Multiplier is 8.3. This means, in theory, it would take just over eight years of rent to match the property’s purchase price (not counting expenses).
What Is a Good Gross Rent Multiplier?
The success of an investment under this metric is measured by the number of years it would take for the rent to equal the purchase price. That is to say, the bigger the number, the less attractive the deal.
So, what is a good gross rent multiplier?
In our experience, a GRM between 4 and 7 is generally considered strong in most markets. The logic is that lower GRMs mean you’re more likely to get your money back faster. Usually, that signals a better deal. On the other hand, a GRM above 10 often suggests your property may be overpriced in proportion to the rent it generates.
Of course, what is considered “good” can shift depending on the city, property type, and market conditions. For example, a GRM of 8 might be fantastic in high-growth areas. Still, in slower ones, investors might consider it to be terrible. Nonetheless, this range can give you a good starting point for comparing properties to find your best buy.
 What Factors Affect a “Good” GRM?
 What Factors Affect a “Good” GRM?
While a GRM between 4 and 7 is generally seen as strong, what counts as “good” isn’t the same everywhere. A few key factors can shift the number:
1. Location
Location has always been the driving force in real estate. When your property is well-located, the chances of units sitting empty are much lower. Properties in high-demand cities often show higher GRMs because purchase prices rise faster than rents. In smaller or less competitive markets, you’ll usually see lower GRMs.
2. Property Type
From what we’ve seen, the type of property really affects GRM. But how, you may ask? Single-family homes, multifamily units, and commercial buildings can all produce very different GRMs. For example, multifamily rentals often deliver lower (better) GRMs because they generate income from multiple rent streams. So, this is something to be aware of.
3. Market Trends
Real estate is always shaped by market trends. Take today, for instance—short-term rentals are on the rise. In some markets, like areas near schools, tenants prefer flexible leases instead of long-term commitments, and that shift changes how rental income looks. In a hot market, demand tends to push prices up faster than rents, which can lead to higher GRMs. On the other hand, when the market slows down, GRMs usually come down too.
4. Condition of the Property
A newly renovated unit typically pulls in higher rent, which then improves the GRM. An outdated one, on the other hand, can drag it down. More specifically, adding modern finishes, better amenities, or energy-efficient systems usually raises its rental value. That can mean fewer years for rent to cover the purchase price. In turn, that can effectively lower your GRM.
Pros of Using GRM
One of the biggest strengths of GRM is how simple it is. With just the purchase price and annual rent, you can quickly size up whether a property looks worth a deeper look. It’s a handy screening tool when comparing multiple properties side by side. Another plus is that it gives you a rough idea of how long it might take for rent to “pay back” the cost of the property, which is especially helpful for new investors who want an easy starting point.
Limitations of GRM
The downside is that GRM only tells part of the story. It doesn’t factor in huge costs like taxes, insurance, repairs, or management fees—all things that can seriously affect your returns and time till ROI. It also overlooks vacancies, appreciation, and how financing changes your cash flow. That’s why GRM works best as a quick first look, not the final answer. To really understand a property’s performance, we’ve seen investors often combine it with other metrics like cap rate or cash-on-cash return.
GRM vs Cap Rate: What’s the Difference?
As we’ve said earlier, you can’t rely on GRM alone. To get a closer picture, it needs to be combined with other metrics. For this discussion, let’s compare it with Cap Rate to see how they differ—and how you can actually use them together.
Aspect |
Gross Rent Multiplier (GRM) |
Capitalization Rate (Cap Rate) |
| What it Measures | Years it takes for rent to match purchase price (before expenses) | Return on investment after expenses |
| Formula | Property Price ÷ Annual Rent | Net Operating Income ÷ Property Price |
| Focus | Quick snapshot of property value vs. rent | Profitability after costs are considered |
| Ease of Use | Very easy – only needs price and rent | More detailed – requires expense information |
| Limitations | Ignores expenses, vacancies, and financing | Can vary with assumptions; harder to compare quickly |
From this table, think of GRM as your quick filter and Cap Rate as your deeper analysis tool.
GRM Tools & Calculators
 GRM Tools & Calculators
If you don’t want to crunch the numbers by hand, there are plenty of online GRM calculators that do the math for you. All you need to plug in is the property’s price and annual rent, and the tool will instantly show the GRM.
- Omni Calculator – Gross Rent Multiplier: This is simple and clean. You enter the property price and gross annual rent, and it gives you the GRM immediately. It’s perfect for quickly comparing a couple of properties.
- ProAPOD GRM Calculator: This one is more robust. It’s part of a package of real estate tools, so if you need more than just GRM — like, say, Cap Rate or Cash-on-Cash Return — this can serve up several metrics.
- Multifamily.Loans – GRM Tool: This tool gives you a little more market context. You can see what “good GRM” ranges are in multifamily or larger rental properties, so you can compare better.
Why Work with a Property Management Partner?
Gross Rent Multiplier is a quick and valuable way to size up a rental property, but it’s not the whole story. Numbers alone can’t show you the full picture of expenses, risks, or changing market conditions. That’s why working with professionals who understand the market inside and out is so important.
At Bay Property Management Group, we go beyond the basics. We use cutting-edge rental industry best practices to maximize your rental’s profit potential. Our professionals can handle your accounting, marketing, rent collections, legal compliance, inspections, and more. It’s a recipe for success that has worked for the over 6,000 rentals we manage across Northern Virginia, Maryland, D.C., Pennsylvania, and more. Want our help? Contact us today!
